From field measurement to finished report — in one app
Built for limnologists and environmental labs. Collect measurements offline in the field, document them with photos, analyse them on charts and create finished PDF reports. Export for STATISTICA and R.
Beta · Free during Beta. Accounts created now will keep the core app free forever — with a permanent −50% discount on add-ons after the beta period.
Install it on any device
On Windows, get LimnoLog straight from the Microsoft Store. As a PWA, install it on your phone and computer right from the browser. A native Android app (QR scanner, GPS, printing) is on the way — currently in Google Play closed testing.
Available as an app in the store:
The whole workflow — from field to report
The field, no compromises
Enter measurements offline — they sync automatically when you're back online. Document the site, sample and anomalies with geotagged photos, print and scan QR labels, and let calculated parameters (N-NH₄, COD, trophic index, your own formulas) compute themselves. All from the app on your phone, too.
Automation that watches for you
Connect a sensor or a public API (e.g. IMGW stations) — LimnoLog polls readings on a schedule, computes derived indicators and watches your guidelines. When a measurement crosses a threshold, project admins get an email alert. Supports JSON, CSV and XML/SOAP, with ready-made templates.
Analysis and reports without Excel
Correlations with a trend line (R²), method comparison (Deming, Bland-Altman), control charts and sample/depth profiles against norms — deeper analysis without spreadsheets. Build a finished PDF report in a live-preview wizard (EN, PL, DE), export to Excel, CSV for STATISTICA/R and PNG, and share a project as an embeddable public dashboard.
Teamwork and ISO-grade quality
Work together with roles, a GPS station map and a sampling planner. A full change history for every measurement, session approval and locking, and quality control in the spirit of ISO 17025. Data in the EU, GDPR compliance and digital accessibility (WCAG) — ready for institutional requirements.
See it in the app
This is what analysis looks like in LimnoLog
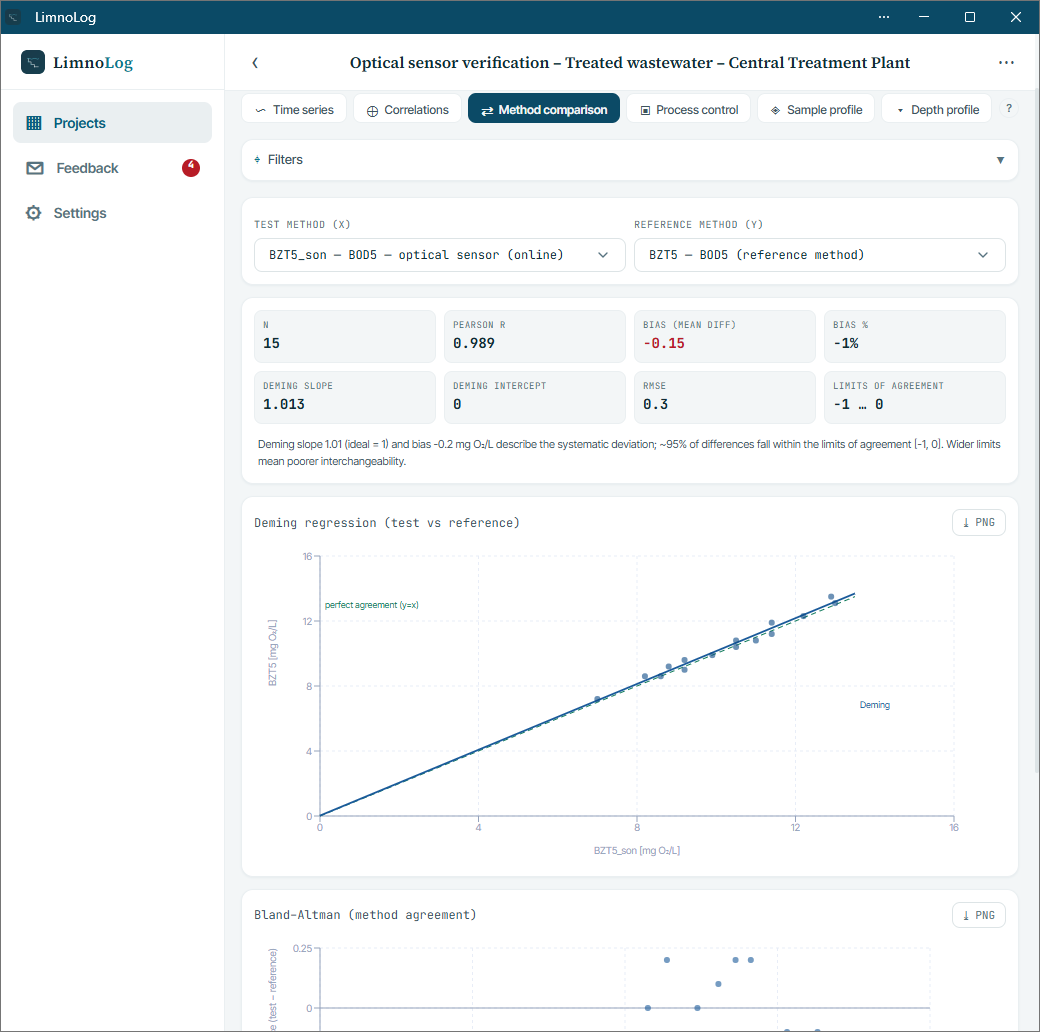
Method comparison
Deming regression and a Bland-Altman plot show whether a new method (e.g. an optical probe) agrees with the reference — bias, RMSE and limits of agreement at a glance.
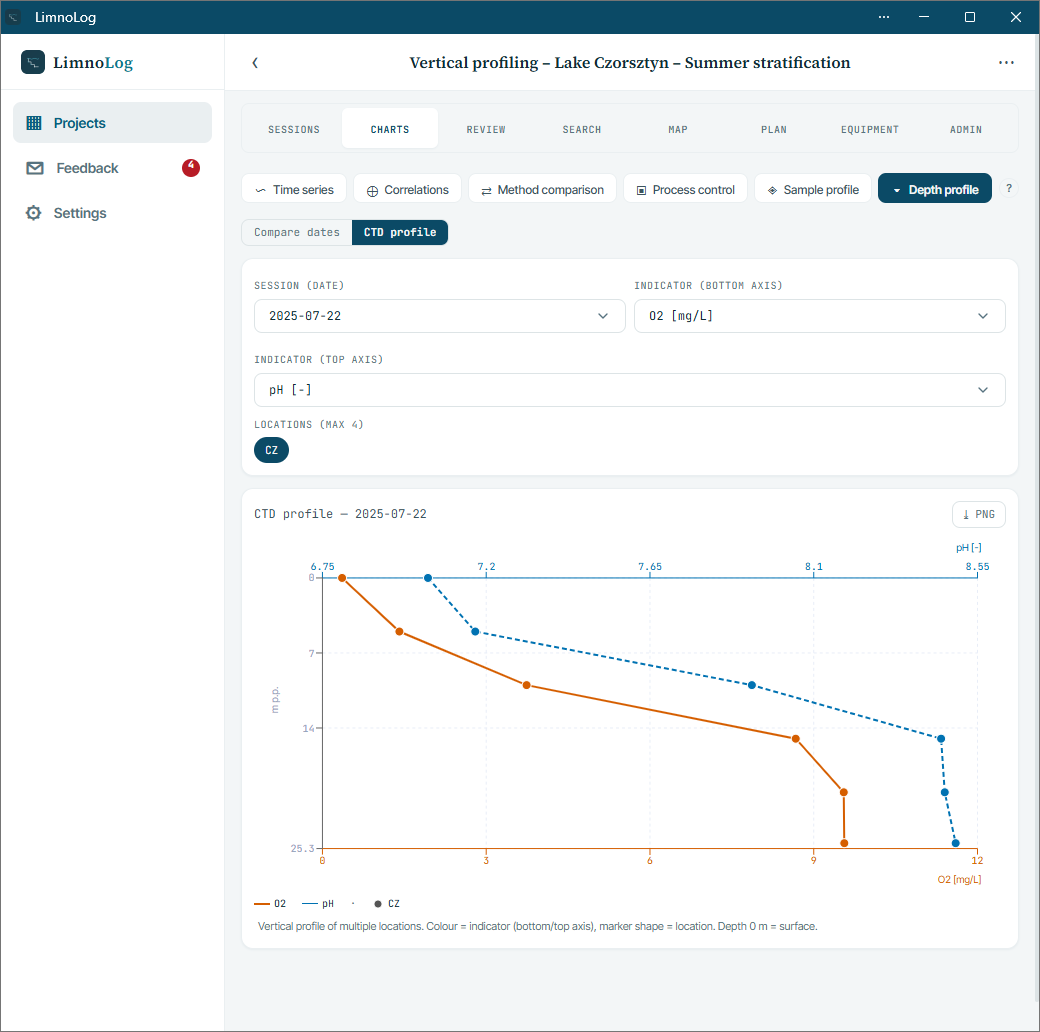
Depth profile
Compare two indicators (e.g. oxygen and pH) across depth at several stations — spot stratification instantly.
Who is it for?
Thesis, field project — a full season of measurement data in one place.
Research stations, biology & environmental faculties — team collaboration with full change history.
Standardised field sessions, automatic OOR flags, ready export for regulatory reports.
Water treatment plants, consultancies — a simpler and more affordable alternative to full LIMS.
How does it work?
Set up your project
Add sampling stations and choose parameters from the dictionary. Done in 5 minutes.
Collect measurements
In the field (offline) or in the lab. Calculated parameters update automatically on every entry.
Analyse and export
Trend charts, out-of-range detection (OOR), export to Excel, PDF or CSV for STATISTICA.
See it live
Vistula in Warsaw — a public dashboard
An example of what LimnoLog does with open data — the Vistula's live water level, available to anyone without logging in (charts, export, embedding).
About the creator
LimnoLog is an independent project developed under the WalFamSystems name by Bartłomiej Walczak. We build tools for Polish and European environmental scientists. Data is stored in the European Union, fully GDPR compliant.
Join the first users
Beta version, currently free. Accounts created now will keep the core app free forever (founder tier) with a permanent −50% discount on add-ons.
Start for free — no credit card required