From spreadsheet to charts and report
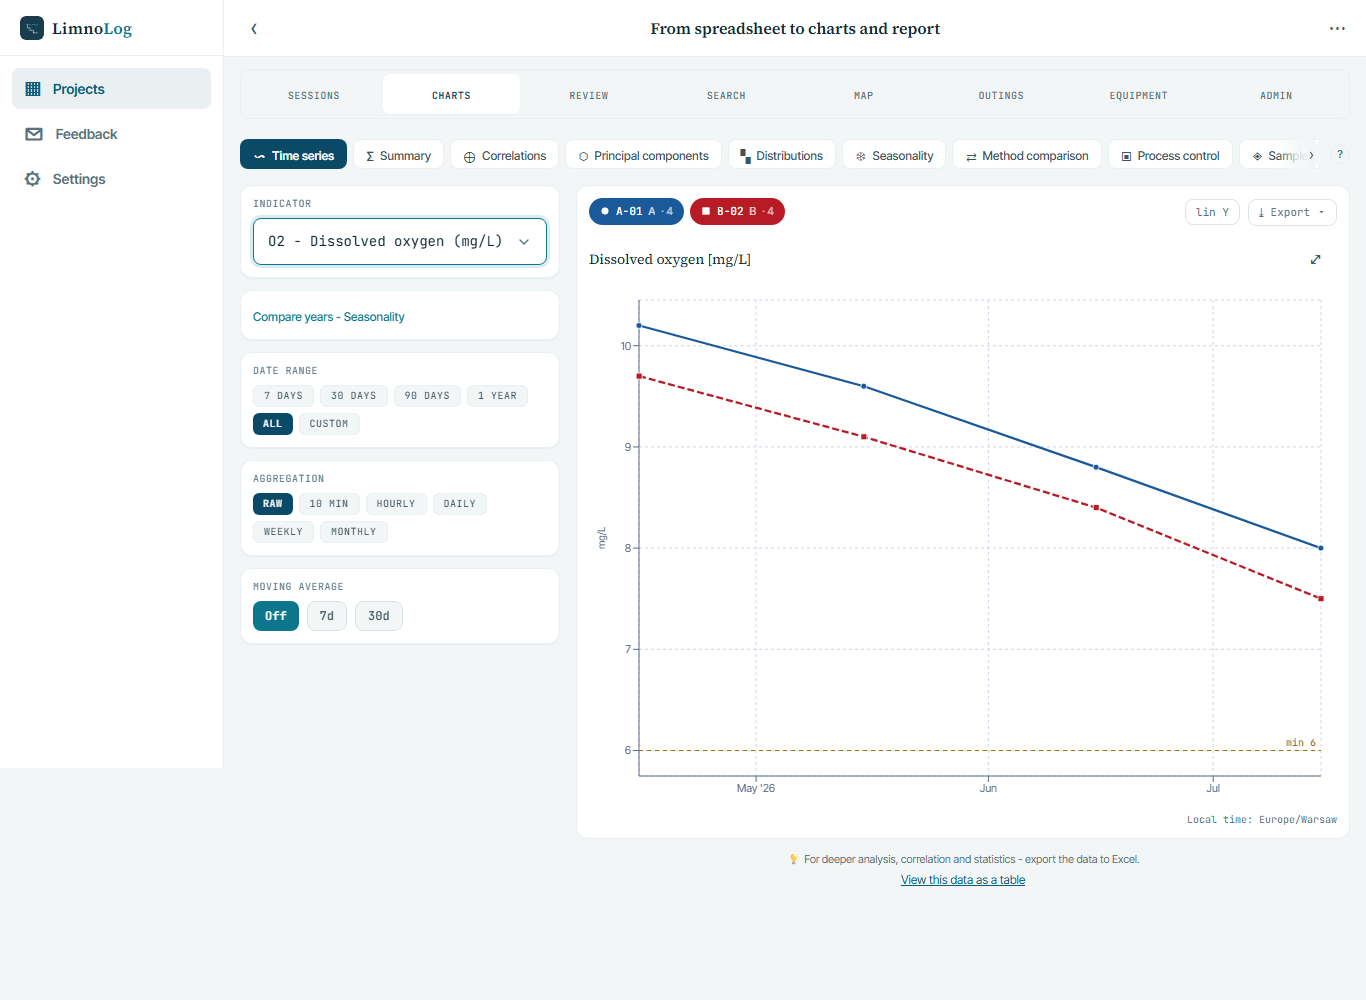
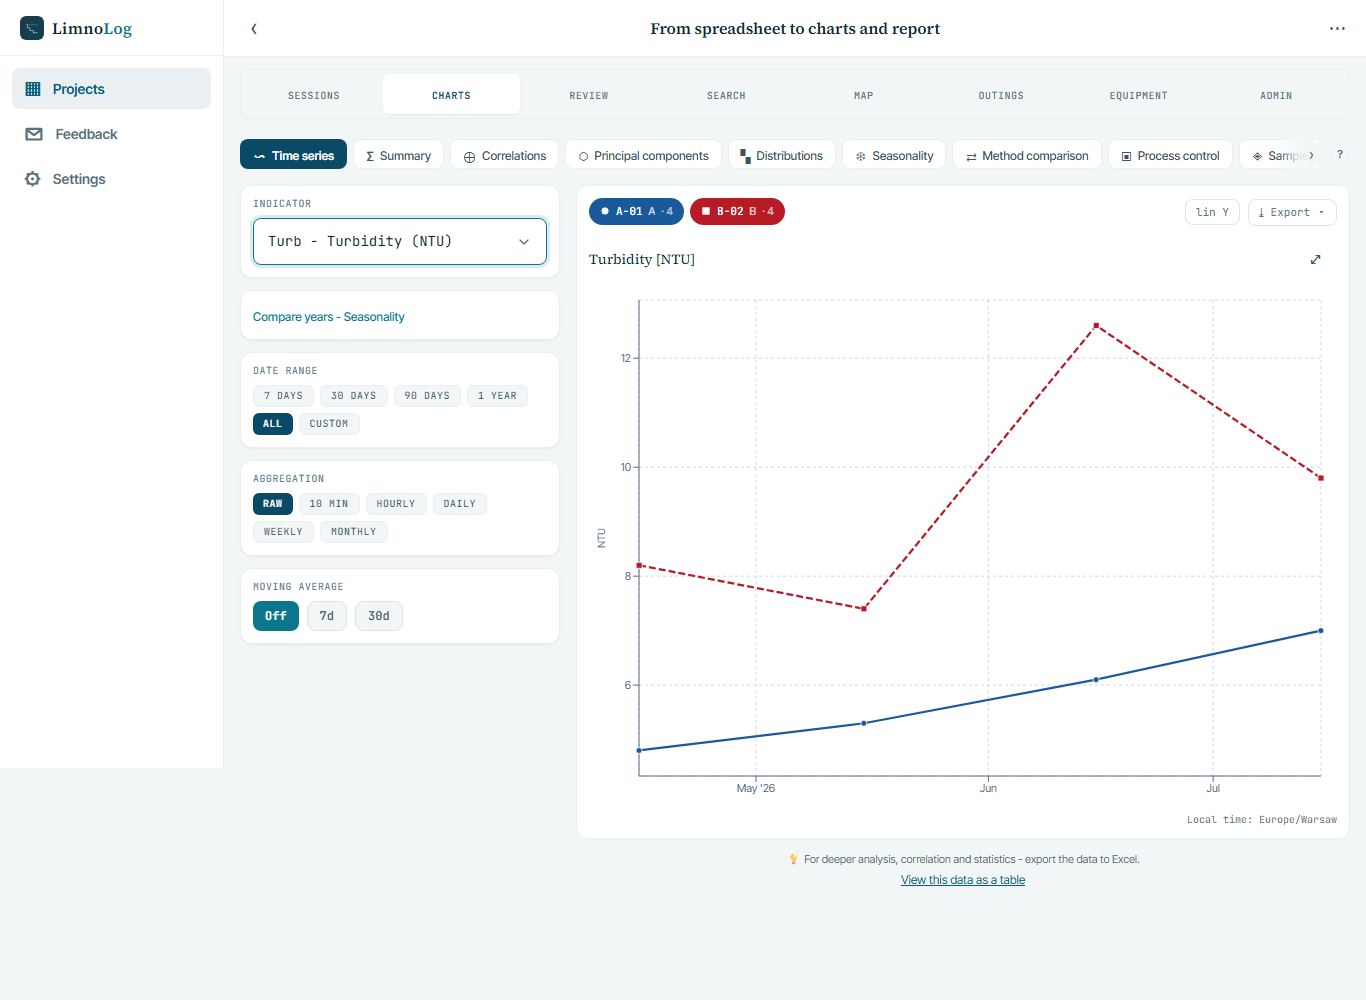
A static example using synthetic data: 24 values for temperature, dissolved oxygen and turbidity from two stations on four dates, from 15 April to 15 July 2026. See the same dataset in a file, charts and a report. The data are for demonstration only and do not describe a real body of water.
CSV
24 values in long format: date, time, station code, parameter code and value. Parameter codes: Temp (°C), O2 (mg/L) and Turb (NTU). The file has English column headers and synthetic data.
Download the sample CSVA report for stations A-01 and B-02, from 15 April to 15 July 2026, prepared from the same synthetic dataset as the CSV and charts. The 6 mg/L oxygen threshold in the report is for demonstration only and is not a standard.
Download the sample PDF report