Verifying measuring devices - method comparison
You buy a new online probe, switch laboratories, or want to replace an expensive lab analysis with a cheaper field measurement. Each case raises the same question: can the new method be trusted as much as the old one? The answer isn’t a gut feeling or a correlation coefficient - it’s a structured method comparison.
Correlation is not agreement
The most common mistake: “the sensor correlates with the lab at 0.99, so it’s fine.” It isn’t enough. A high Pearson r only tells you that both methods rise and fall together - yet the sensor may be systematically high by a fixed amount or a fixed percentage. Correlation won’t catch that. Assessing interchangeability of methods calls for different tools.
The toolkit that actually answers the question
- Deming regression - a fit line that, unlike ordinary OLS regression, assumes error on both axes. When neither method is the absolute truth, this is the right choice. A slope ≈ 1 and intercept ≈ 0 mean no proportional and no constant error.
- Identity line (y = x) - the “perfect agreement” reference. The closer the points lie to it, the better.
- Bias (mean difference) and bias % - how far, on average, the test method departs from the reference. This is the measure of systematic error.
- Bland-Altman plot - the difference between methods against their mean, with limits of agreement (±1.96 SD). It shows whether the discrepancy is constant or grows with concentration, and how large the differences realistically get.
- RMSE - the typical error magnitude in measurement units.
- N - the number of paired measurements; without enough pairs the conclusions are fragile.
What it looks like in practice
Below: verification of an online optical probe (test method) against a laboratory BOD₅ determination (reference method) on the same treated-wastewater sample:
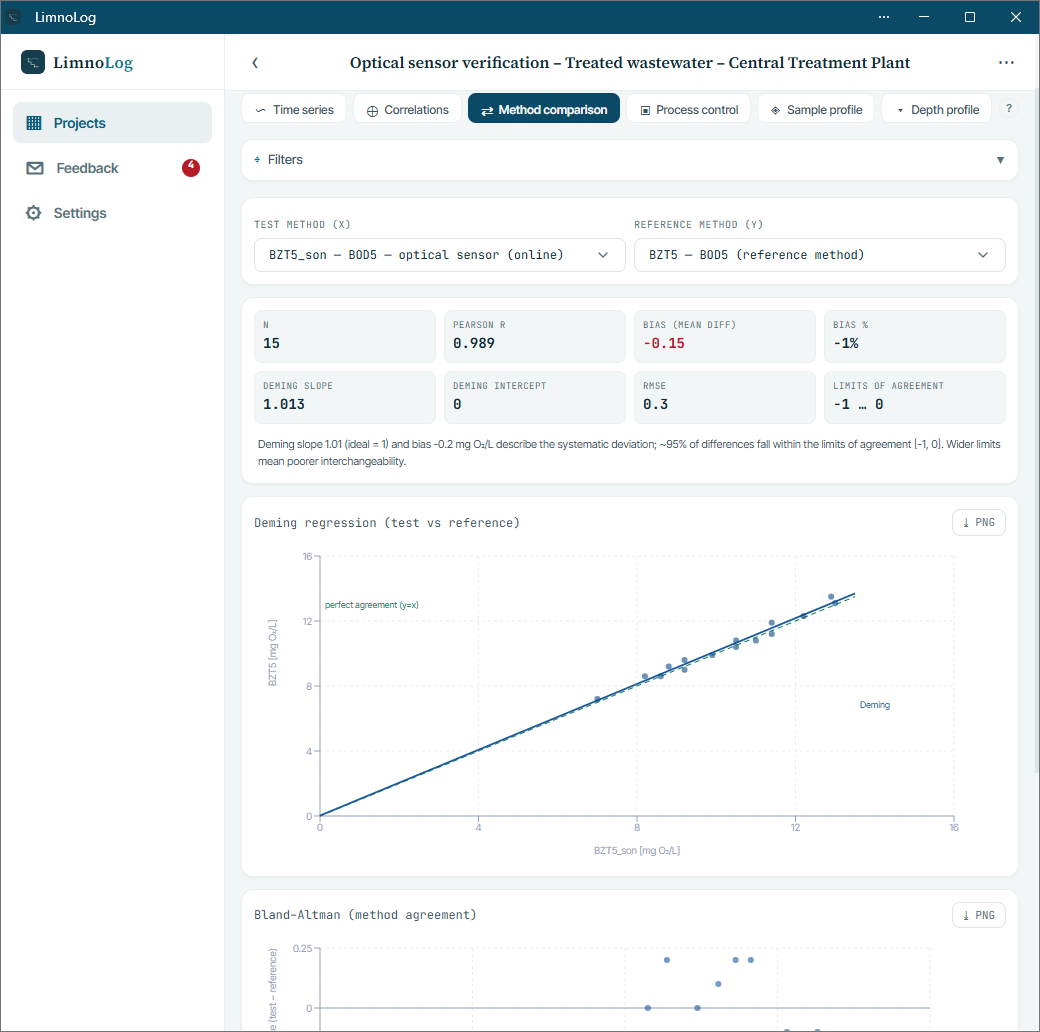
How to read it: a Deming slope of 1.01 (ideal = 1) and a bias of a few tenths of mg O₂/L mean the probe has no meaningful proportional or constant error. On the Bland-Altman plot ~95% of the differences fall within narrow limits of agreement - the methods are effectively interchangeable. Had the points been tilted or the limits wide, that would signal the cheaper method cannot safely stand in for the reference.
The decision: when are methods interchangeable
There is no single threshold - it depends on what the data are used for. Helpful questions:
- Are the limits of agreement narrower than a difference that would matter in practice (e.g. a decision threshold or a standard)?
- Is the bias small enough to ignore - and if not, is it constant and therefore correctable?
- Does the discrepancy not grow with concentration (no tilt on the Bland-Altman plot)?
If the answers are “yes”, you can adopt the cheaper/faster method with a clear conscience.
In LimnoLog
The app handles this in Charts → Method comparison. All you need is to record both the test and the reference result in the same sample (session + station) - for example a telemetry-probe parameter alongside a lab determination. LimnoLog pairs the measurements automatically and computes the Deming regression, bias, limits of agreement and Bland-Altman. It’s a natural complement to sound QA/QC practice and broader statistical analysis; for continuous measurements themselves, see Telemetry and online sensors.
Start a project in LimnoLog and verify your equipment on your own data.
← Knowledge base